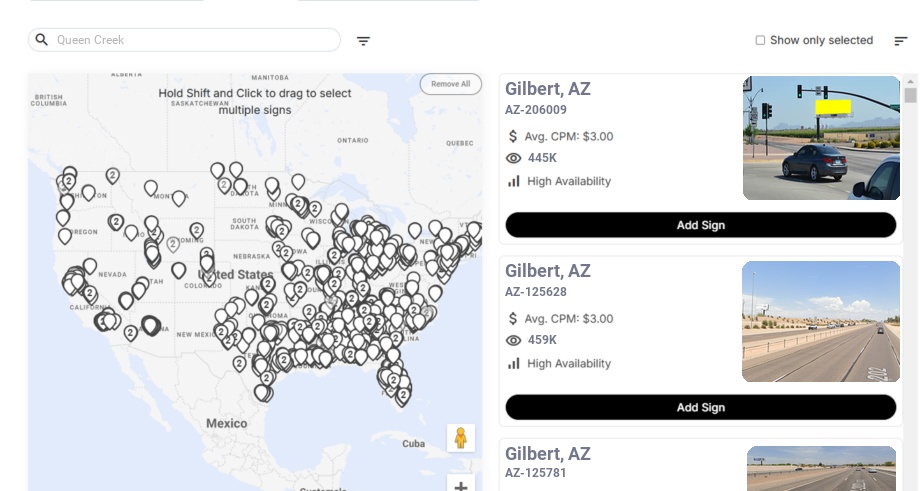
Billboards in Queen Creek, AZ
No Minimum Spend. No Long-Term Contracts. Just Results.
Turn drives into eyeballs with Queen Creek billboards that fit any budget. Blip makes it easy to launch, pause, and tweak campaigns on digital billboards near Queen Creek, Arizona, giving your message playful, high-impact visibility in the Queen Creek area—no long-term contracts required.
Trusted by Leading Brands


Billboard advertising
in Queen Creek has
never been easier
HERE'S HOW IT WORKS
How much is a billboard in Queen Creek?
Queen Creek Billboard Advertising Guide
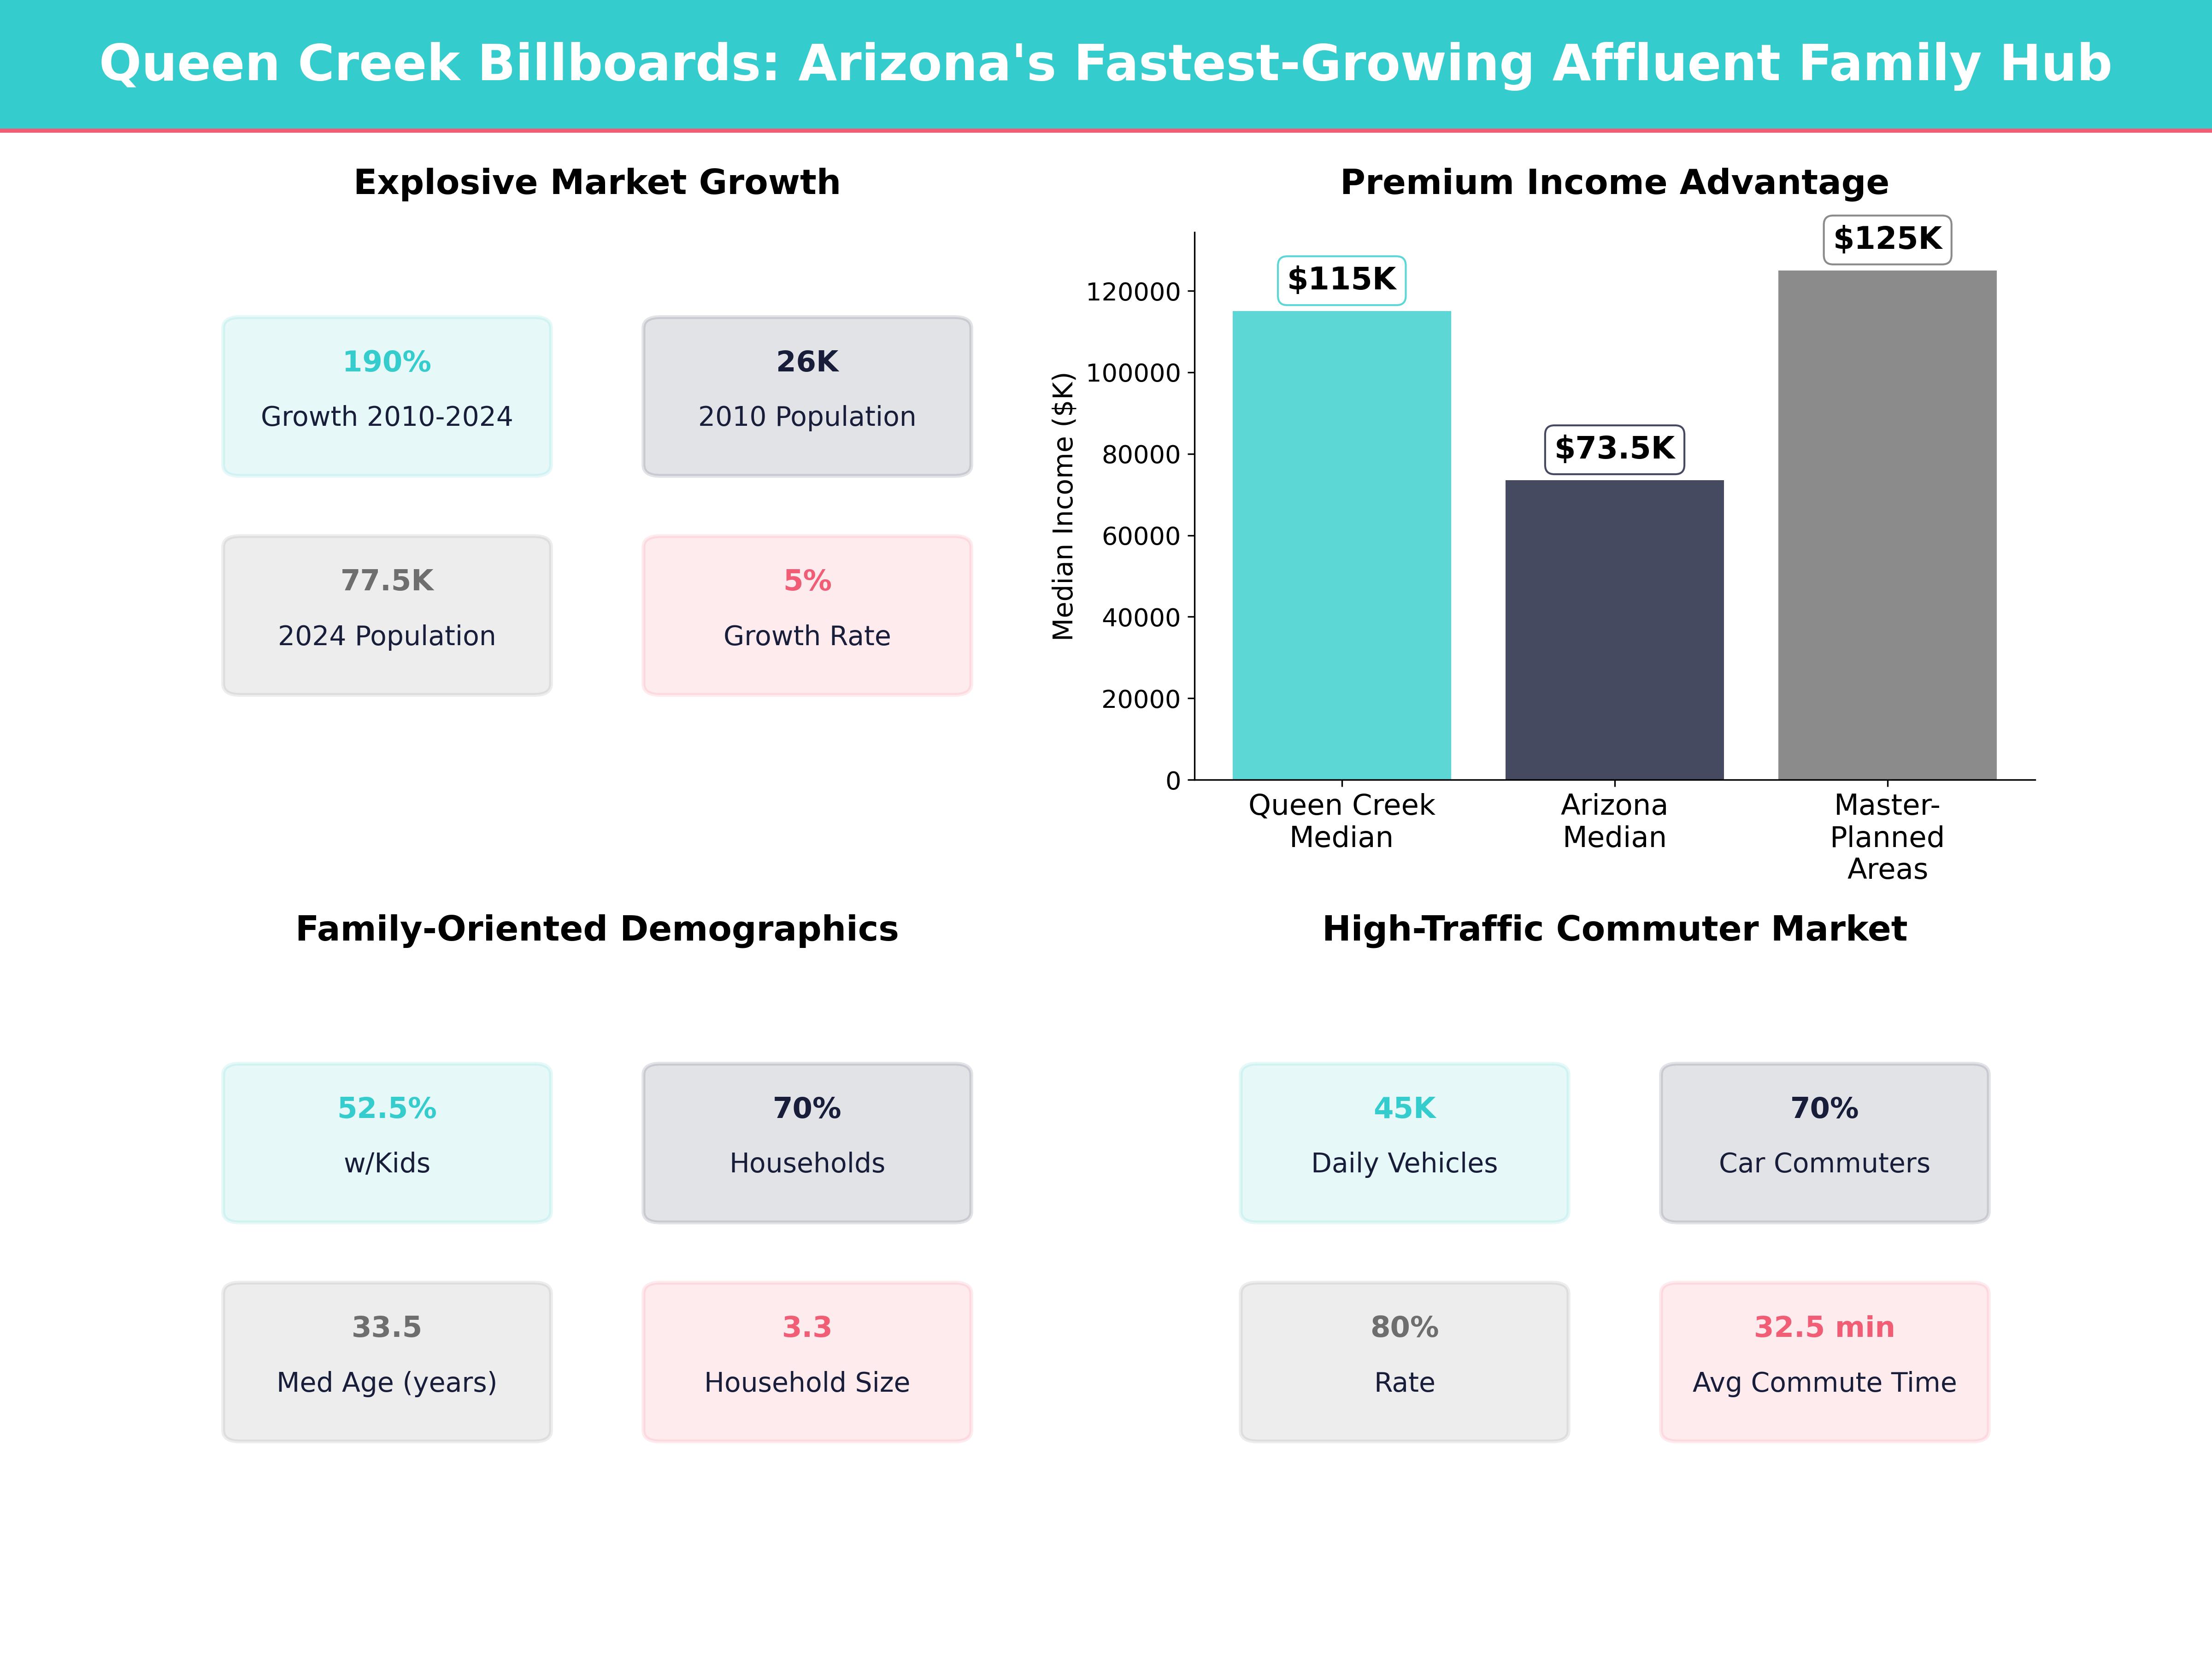
Queen Creek is one of the fastest‑growing communities in the Phoenix East Valley, and that growth creates a powerful opportunity for digital billboard advertisers. With 9 Blip digital billboards in nearby Gilbert—within about 8.4 miles of Queen Creek—we can help you reach commuters, families, and high‑income households moving through the Queen Creek area every day. If you’re exploring billboards near Queen Creek for local brand awareness, Blip’s flexible digital placements give you consistent visibility without long‑term commitments.
Understanding the Queen Creek Area Market
Queen Creek sits on the southeastern edge of the Phoenix metro and has transformed from a rural town into a major family and commuter hub, making it an ideal market for targeted billboard advertising near Queen Creek.
Key market facts (latest available public data from the Town of Queen Creek
-
Population growth: Queen Creek’s population has grown from about 26,000 in 2010 to an estimated 75,000–80,000 residents by 2024, an increase of more than 190% in roughly 15 years. The Town’s adopted General Plan anticipates a future build‑out of 100,000+ residents as remaining master‑planned communities develop.
- Town of Queen Creek community profile: queencreekaz.gov
- Queen Creek economic development overview: https://www.queencreekaz.gov/departments/economic-development
- Young, family‑heavy demographic: The median age in Queen Creek is roughly 33–34 years, versus about 38–39 years for the U.S. overall. More than 50–55% of households have children under 18, and nearly 70%+ of households are family households, making the area especially attractive for family‑oriented brands, schools, healthcare, entertainment, and youth activities.
- High incomes: Median household income in Queen Creek is commonly reported in the $110,000–$120,000 range, with many master‑planned neighborhoods reporting median incomes well above $125,000. By comparison, Arizona’s statewide median household income is around $72,000–$75,000, highlighting Queen Creek’s significantly higher spending power for big‑ticket purchases like vehicles, home improvement, and travel.
- Housing & homeownership: Queen Creek’s housing stock is dominated by single‑family homes, with homeownership rates typically above 80%, versus a national rate near 66%. New‑build activity is strong, with hundreds to thousands of new building permits issued annually over the past several years as subdivisions like Harvest, Terravella, and Barney Farms fill in.
-
Commuter base: A large share of residents commute to jobs in Gilbert, Chandler, Mesa, Tempe, and Phoenix. Average commute times are commonly reported near 30–35 minutes, compared with a U.S. average of about 26–27 minutes, and well over 70% of workers commute alone in a car, truck, or van. That means reliable exposure on arterial roads and freeways near Gilbert where our boards are located.
- Regional transportation & commute data: Maricopa Association of Governments – Travel Data
- Regional transit information: Valley Metro
-
Regional context: The Phoenix metro area has grown past 5.0–5.1 million residents, adding more than 500,000 people in the last decade alone. The East Valley (Gilbert, Chandler, Mesa, Queen Creek) has captured a large share of that growth—Gilbert and Queen Creek together now account for roughly 360,000+ residents.
- Greater Phoenix tourism & regional overview: Visit Phoenix
These dynamics mean digital billboards near Queen Creek can efficiently reach:
- Young families with disposable income
- Commuters heading toward major job centers
- New residents making decisions about home services, schools, and local businesses
- Visitors and “agritainment” tourists attracted to farmland‑based attractions
For brands that need Queen Creek billboards but don’t want the cost and rigidity of traditional static placements, nearby digital inventory offers a flexible alternative.
Why Billboards Near Gilbert Work for the Queen Creek Area
Our 9 digital billboards in Gilbert are positioned along key routes that Queen Creek residents regularly use to access shopping, work, dining, schools, and entertainment. This makes them functionally equivalent to placing billboards near Queen Creek, even though the structures sit just over the city line.
- Major corridors connecting the Queen Creek area to Gilbert and the rest of the East Valley
- Access points to freeways like Loop 202 (Santan Freeway) and State Route 24, which funnel traffic from Queen Creek into the broader Phoenix metro
- Retail and dining hubs where Queen Creek residents frequently shop and dine
From a numbers standpoint:
- Gilbert Road, Val Vista, and Power Road carry typical daily traffic volumes in the 35,000–55,000 vehicles per day range on key segments, according to regional counts.
-
Loop 202 segments in Gilbert often exceed 150,000 average daily vehicles (AADT), creating massive impression potential at freeway‑adjacent faces.
- State highway traffic counts: Arizona Department of Transportation – Traffic Data
Although the faces are physically in Gilbert, the practical reach is squarely into the Queen Creek area because:
-
Queen Creek residents often drive into Gilbert for big‑box retail, medical services, national restaurant chains, and major employers. Retail reports show Gilbert’s regional centers draw customers from 10–15+ miles away, easily encompassing the Queen Creek area.
- Gilbert business & shopping information: Discover Gilbert
- Queen Creek is still building out its own commercial base, so consumer flows naturally spill over into nearby cities. As of recent years, Queen Creek’s jobs‑to‑housing ratio has remained below 1 job per household, meaning many residents work elsewhere but spend on the way to and from work.
-
Gilbert itself has over 280,000–285,000 residents, giving you a two‑for‑one effect: you reach both Queen Creek residents and Gilbert locals with the same impressions.
- Town of Gilbert
Placing digital billboard ads at these choke points lets you influence decisions at critical moments—on the way to work, school, shopping, or weekend activities. For many advertisers, this strategy delivers the impact of Queen Creek billboards with the added benefit of capturing broader East Valley traffic.
Audience Segments to Target Near Queen Creek
Given Queen Creek’s profile, we should think about campaigns in terms of distinct high‑value audience segments. Tailoring billboard advertising near Queen Creek to these specific groups helps you stretch your budget and drive more measurable results.
1. Growing Family Households
- Queen Creek’s household structure skews strongly toward families: more than 50–55% of households have children and the average household size is around 3.2–3.4 people, compared with the U.S. average of about 2.5.
-
Consumer expenditure data for high‑income, child‑present households shows annual spending that can exceed:
- $12,000–$14,000 on food (groceries + dining out)
- $3,000–$5,000 on entertainment and recreation
- $2,000–$3,000 on education and childcare‑related costs
Heavy spending goes to groceries, childcare, youth sports, family entertainment, and home improvement.
Effective billboard angles for this group:
- After‑school activities, sports leagues, tutoring, music lessons
- Pediatricians, dentists, orthodontists, and family medical practices
- Local restaurants with kid‑friendly offerings (kids eat free nights, playgrounds, family value meals)
- Home services: landscaping, pools, pest control, HVAC, cleaning, and security systems
Timing:
-
Run more impressions weekday afternoons (2–7 p.m.) to catch school pick‑ups, activities, and dinner decisions. Local school dismissal windows typically fall between 2:30 and 3:30 p.m., with after‑school traffic peaking shortly after.
- Queen Creek Unified School District
- Increase weekend presence for family outing destinations, seasonal attractions, and churches, especially Saturday 10 a.m.–2 p.m. and Sunday morning.
2. Commuters & Professionals
- Many Queen Creek residents work in Gilbert, Chandler, Mesa, Tempe, or Phoenix tech and business corridors. East Valley employment centers like the Price Road Corridor in Chandler and the Gateway area near Phoenix‑Mesa Gateway Airport support tens of thousands of jobs in tech, aerospace, and advanced business services.
- In high‑growth suburbs with median incomes over $100,000, labor statistics typically show 40–50% of residents employed in management, business, science, sales, and office occupations, indicating a substantial professional class.
- Higher‑income commuters are more likely to respond to professionally oriented, time‑sensitive messages and can support average ticket sizes in the $500–$2,000+ range for services like financial planning, elective medical, and home improvement.
Ideal verticals:
- Auto dealers, especially trucks and SUVs popular with East Valley families—Arizona routinely ranks among the top 10 states for new light‑vehicle registrations per capita.
- Financial services, mortgage brokers, insurance agents, and real estate teams
-
Career colleges, universities, and professional certification programs
- Nearby higher‑education presence: Chandler‑Gilbert Community College Arizona State University
- Coworking spaces or remote‑worker‑friendly cafes and services
Timing:
- Morning commute (6–9 a.m.) and evening commute (3–7 p.m.) are prime, corresponding to typical East Valley peak‑hour volumes where traffic can be 30–60% higher than mid‑day flows.
- Use Blip’s scheduling tools to concentrate budget on these windows instead of spreading spend thinly across 24 hours.
3. New Movers & Homeowners
Queen Creek is a magnet for new construction and master‑planned communities:
- Over the last decade, Queen Creek has consistently ranked among Arizona’s fastest‑growing towns, with annual population growth rates often in the 4–6% range—several times the national average of around 0.5–1.0%.
- New subdivisions commonly add hundreds of homes per phase, and multi‑year master plans can total 1,000–5,000+ lots.
- Homeownership is high (often 80%+), and many buyers are relocating from other Arizona cities or out‑of‑state, particularly California and the Midwest.
Perfect billboard categories:
- Homebuilders and master‑planned communities marketing to new buyers
- Furniture, appliances, flooring, and home décor
- Internet and utility providers
-
Churches, gyms, and community organizations seeking to welcome new residents
- Local business & relocation resources: Queen Creek Chamber of Commerce
Call‑to‑action ideas:
- “New to the Queen Creek area? Visit [Brand] this weekend.”
- “Just moved? Save 15% on your first service.”
Local Traffic Patterns and Best Times to Advertise
To get the most from digital billboards serving the Queen Creek area, we want to align your schedule with actual traffic flow. Smart billboard rental near Queen Creek means focusing your spend on the hours and days when your audience is most likely to be on the road.
Key patterns (based on common East Valley commuting and shopping behavior; refine further with your own customer data):
- Weekday morning peak: 6:30–9:00 a.m.
Commuters heading north and west toward major employment centers via surface streets and freeway ramps. In many East Valley corridors, 30–35% of daily traffic can occur during the combined morning and evening peak periods. - School and mid‑day traffic: 10:00 a.m.–2:00 p.m.
Parents with younger children, retirees, and stay‑at‑home workers running errands at retail centers in Gilbert. Grocery and big‑box retailers often report 20–25% of weekly sales occurring on weekdays during these late‑morning and mid‑day windows. - Afternoon/evening peak: 3:00–7:00 p.m.
Return commute plus school pick‑up, youth sports, and dinner trips. Many arterial segments in Gilbert and Queen Creek see traffic volumes increase 40–60% over mid‑day baselines after 3 p.m. -
Weekend surges:
- Saturday late morning to early afternoon for big‑box and mall shopping; national retail data often shows 30–40% of weekly in‑store visits concentrated on Saturday and Sunday.
-
Seasonal weekend traffic to nearby attractions such as:
- Schnepf Farms (festivals, U‑pick events): schnepffarms.com
- Queen Creek Olive Mill (tours, events): queencreekolivemill.com
These agritainment venues routinely draw thousands of visitors on peak festival weekends, many traveling in from other parts of the Valley.
Blip’s flexibility allows you to:
- Increase bid amounts and frequency during known peak windows (e.g., Friday evening and Saturday morning for retail).
- Pull back spend during low‑value times (late night) unless you specifically want 24/7 presence for branding.
Seasonal Opportunities in the Queen Creek Area
Local behavior shifts throughout the year. Matching your campaign calendar to the Queen Creek area’s seasonal rhythms can dramatically improve performance and help your billboard advertising near Queen Creek stay relevant all year.
Fall (September–November)
- Back‑to‑school and youth sports seasons are in full swing; school districts across the East Valley enroll tens of thousands of K–12 students, driving heavy family traffic around campuses and sports fields.
- Major agritainment events at Schnepf Farms and other local venues create spikes in weekend traffic. Fall festivals, pumpkin patches, and corn mazes can see attendance increases of 50–100% over non‑event weekends.
- Temperatures start to drop from triple digits to average highs in the 80s–90s°F, increasing outdoor dining and shopping.
Campaign ideas:
- After‑school programs, tutoring, and sports clinics
- Fall events, festivals, pumpkin patches, and corn mazes
- Home improvement and landscaping services as residents prep yards and outdoor spaces
Winter & Snowbird Season (December–February)
-
Phoenix‑area tourism increases, particularly around the holidays and major sporting events. Visit Phoenix reports that the Greater Phoenix area welcomes tens of millions of visitors annually, with winter months among the strongest.
- Tourism data and events: Visit Phoenix
- Winter visitors and “snowbirds” from colder states boost spending at restaurants, golf courses, and attractions. In some resort and golf areas, winter visitor volumes can rise 20–30% over off‑season.
- Average daytime highs in the 60s–70s°F make outdoor recreation especially attractive compared with much of the country.
Campaign ideas:
- Restaurants, wineries, breweries, and entertainment venues
- Golf courses and outdoor recreation
- Healthcare services targeting retirees (vision, hearing, orthopedics)
- Holiday retail promotions and end‑of‑year sales
Spring (March–May)
- Traditionally one of the most pleasant weather periods; outdoor activities surge with highs in the 70s–80s°F.
- Spring training across the metro draws hundreds of thousands of visitors to Cactus League games, some of whom stay or explore the East Valley.
- Real estate activity often peaks as families plan moves before the next school year; in many markets, 30–40% of annual home sales occur between March and June.
Campaign ideas:
- Real estate teams, homebuilders, and mortgage lenders
- Outdoor living products (patios, pools, pergolas, landscaping)
-
Spring events, school fundraisers, and community festivals
- Local events listings: Town of Queen Creek Community Calendar
Summer (June–August)
-
Very hot temperatures (often 105–110°F+ highs, with extreme heat days exceeding 115°F) shift behavior toward:
- Early morning errands
- Evening activities once the sun slows down
- Indoor entertainment, waterparks, and travel
- Utility data for the Phoenix area shows summer electricity use often doubles compared with winter months, highlighting demand for HVAC, energy efficiency, and solar.
Campaign ideas:
- Indoor family entertainment (bowling, trampoline parks, escape rooms, movie theaters)
- Travel agencies, resorts, and staycations
- HVAC services, energy‑efficient windows, and solar
- Back‑to‑school promotions starting mid‑July
With Blip, you can adjust your spend week‑to‑week and even day‑to‑day based on weather, events, and seasonal needs, rather than being locked into static placements or long‑term Queen Creek billboard rental contracts.
Crafting Effective Creative for the Queen Creek Area
Queen Creek‑area drivers are busy, often juggling work, kids, and activities. Your creative must cut through quickly.
Keep Messages Short and Clear
- Aim for 6–10 words of main text. Eye‑tracking studies of digital billboards show readability and recall drop sharply when messages exceed about 7–8 seconds of reading time—roughly equivalent to a short headline and one line of support.
-
Use a single strong call‑to‑action:
- “Visit This Weekend”
- “Book Today”
- “Call for Same‑Day Service”
- “Enroll by August 15”
- Use large, high‑contrast fonts so messages are readable at speed. At typical highway speeds of 45–55 mph, drivers may have only 5–7 seconds to absorb your message.
Use Visuals That Reflect Local Life
Resonant imagery for the Queen Creek area:
- Young families, kids in sports uniforms, parents with strollers
- Trucks and SUVs, suburban neighborhoods, and backyard living
- Outdoor scenes: desert landscapes, sunsets, farm‑style or rustic visuals
-
Local landmarks: stylized nods to agritainment venues, the San Tan Mountains, or desert flora (without cluttering the design)
- San Tan Mountain Regional Park info: Maricopa County Parks
When relevant, reference specific nearby destinations Queen Creek residents know, such as:
- “Minutes from the Queen Creek Olive Mill”
- “On the way to San Tan Mountain Regional Park”
- “Just north of the Queen Creek area”
Emphasize Convenience and Proximity
Because many Queen Creek residents drive into Gilbert and beyond:
- Use phrases such as “Just a short drive from the Queen Creek area” or “On your way home to Queen Creek.”
- Highlight easy access from major routes: “Near Loop 202,” “Off Ellsworth,” etc. (without suggesting a board is physically in Queen Creek when it is near Queen Creek).
- In surveys of suburban shoppers, 60–70% cite drive time and ease of access as top factors in choosing where to dine, shop, or seek services—messaging around convenience can materially increase response.
Consider Bilingual or Multicultural Messaging
The broader East Valley has a substantial Hispanic population; in many nearby communities, 20–30% of residents identify as Hispanic or Latino.
If your customer base includes Spanish‑speaking audiences:
- Test bilingual creative (English + Spanish) with key phrases and value propositions.
- Prioritize simple, direct offers that work visually in both languages.
- Keep total text short—adding a second language can double word count, so be selective with wording.
Using Blip’s Tools Strategically for the Queen Creek Area
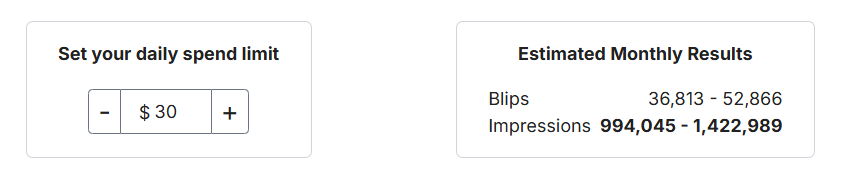
Digital billboards through Blip give you control over when, where, and how often your ads appear—important in a fast‑growing, commuter‑heavy area like Queen Creek. This level of control is especially valuable if you’re new to billboard rental near Queen Creek and want to start with a test budget before scaling.
Here’s how we recommend using that flexibility:
1. Dayparting Around Commuter and Family Routines
-
Focus bids on:
- 6–9 a.m. & 3–7 p.m. for commuter‑focused messaging
- 10 a.m.–2 p.m. for stay‑at‑home parents, retirees, and mid‑day shoppers
- Weekends for retail, entertainment, and events
You can run different creative by time of day, such as:
- Morning: “Schedule Your Appointment Before Work”
- Afternoon: “Pick Up Dinner on Your Way Back to the Queen Creek Area”
Advertisers who align creatives with dayparts often see 20–30% higher click‑through or response rates in supporting digital channels compared with all‑day generic messaging.
2. Event‑Triggered Bursts
Use short, intense flights around:
- Grand openings in or near the Queen Creek area
-
Community events listed on the Town’s calendar:
- Queen Creek events: Town of Queen Creek Community Calendar
- Local sports tournaments, school events, or church conferences
- Seasonal promotions (e.g., tax‑time, Black Friday, back‑to‑school)
Because Blip allows you to set low daily minimums, it’s easy to scale up for a few days or weeks and then scale back. Advertisers that pair event‑driven bursts with social and email campaigns often report double‑digit percentage lifts in event attendance or opening‑week sales compared with digital‑only efforts.
3. A/B Testing Creative
Run two or more creatives on the same boards near the Queen Creek area to see what resonates:
- Version A: Brand‑heavy, lifestyle imagery
- Version B: Direct offer (“$49 New Patient Special,” “$0 Enrollment Fee This Month”)
Track:
- Website traffic lifts from the Queen Creek/Gilbert area
- In‑store mentions (“Saw you on the billboard”) using a specific promo code
- QR scans or short URLs that appear only on certain creatives
Shifting impressions toward the top‑performing creative can improve your cost per response by 20–40% over time.
4. Always‑On Brand Presence in a High‑Growth Market
Because Queen Creek is adding residents so quickly, new people are constantly entering the market. Consider a modest, always‑on campaign that:
- Maintains baseline presence on select boards near Queen Creek
- Spikes during your key sales periods
- Keeps your brand consistently visible to both long‑time residents and new arrivals
Brand‑lift studies for out‑of‑home consistently show that sustained exposure over 3–6 months can increase unaided brand awareness by 10–20 percentage points, especially in high‑growth suburbs where many residents are new. A steady, lower‑cost approach to billboard rental near Queen Creek can be more cost‑effective than short bursts with long dark periods.
This blend of continuity and flexibility can be more cost‑effective than short bursts with long dark periods.
Industry Examples That Fit the Queen Creek Area
Some types of businesses are especially well‑positioned to leverage billboards serving the Queen Creek area:
- Home Services & Contractors: HVAC, solar, pool builders, landscaping, remodeling, pest control—leveraging the high homeownership and new builds. In high‑income, owner‑occupied suburbs, annual household spending on housing‑related services can exceed $5,000–$7,000 per home.
- Healthcare & Wellness: Family medical practices, urgent care centers, dentists, orthodontists, physical therapy, gyms, and boutique fitness studios. With a large child and teen population, pediatric and orthodontic services can see strong demand.
- Real Estate & Finance: Real estate teams, new home communities, mortgage brokers, credit unions, and insurance agents. In fast‑growing communities, annual home turnover can be 1.5–2x the national average.
- Education & Youth: Private schools, charter schools, preschools, tutoring centers, music and dance studios, youth sports leagues. Charter and choice schools have strong penetration in the East Valley, with thousands of students enrolled in non‑district options.
- Food & Entertainment: Restaurants, coffee shops, breweries, family entertainment centers, movie theaters, and special events. Households with incomes above $100,000 often spend $4,000–$6,000 per year dining out.
-
Local Government & Public Service: Town information campaigns, public safety messages, event announcements, and voting reminders.
- Town news and updates: Town of Queen Creek News
- Elections & voter information (Maricopa County): Maricopa County Elections
Aligning message timing with when your target consumers are on the road makes these industries especially effective on digital billboards near Queen Creek.
Integrating Local Media and Digital Channels
To maximize results, we encourage pairing digital billboards with your online and local media efforts.
-
Local news and community outlets can amplify your message:
- Queen Creek Sun Times
- East Valley Tribune
- The Arizona Republic / azcentral.com
-
Tourism and community guides help capture visitor and newcomer traffic:
- Queen Creek visitor & community info: https://www.queencreekaz.gov/community
- Discover Gilbert (regional dining, shopping, and events): https://www.discovergilbert.com
Use billboards to:
- Reinforce social and search campaigns (“Search ‘[Brand] Queen Creek’ for details”)
- Promote coverage or features in local news
- Drive traffic to landing pages tailored to Queen Creek‑area residents
Track performance by:
- Creating URL parameters specifically for campaigns targeting the Queen Creek area
- Offering QR codes for longer dwell‑time locations (like near intersections where appropriate and readable)
- Encouraging direct response: “Text QUEEN to [number]”
Advertisers that integrate out‑of‑home with digital retargeting frequently see 15–30% higher conversion rates than with digital alone, because billboard exposure primes recognition when users later see online ads.
Putting It All Together
The Queen Creek area is a rare combination of:
- Rapid population growth (nearly tripling since 2010)
- Young, family‑oriented demographics (median age around 33–34 with a majority of households having children)
- High household incomes (often $110,000–$120,000+)
- Strong commuter flows through nearby Gilbert (tens of thousands of vehicles daily on key corridors)
With 9 strategically located digital billboards near Queen Creek, we can help you tap into this momentum with campaigns that:
- Target the right audience segments (families, commuters, new movers).
- Align with local traffic patterns and seasonal behavior.
- Use concise, locally resonant creative.
- Take full advantage of Blip’s flexible scheduling and budgeting tools.
By thoughtfully planning your message, timing, and frequency around how people in the Queen Creek area actually live and move, you can turn digital billboards—and especially cost‑efficient billboard rental near Queen Creek—into one of the highest‑impact channels in your marketing mix.