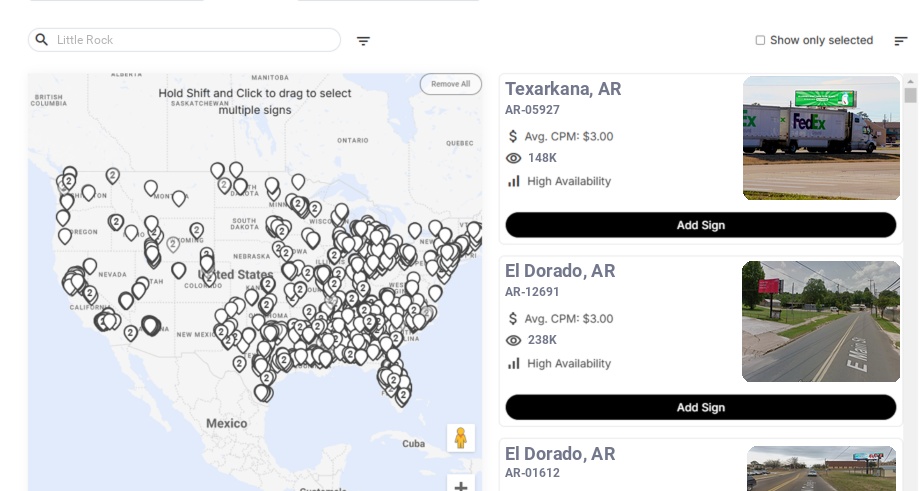
Billboards in Little Rock, AR
No Minimum Spend. No Long-Term Contracts. Just Results.
Turn heads with Little Rock billboards made easy. Blip lets you set your budget, choose when you appear, and swap designs anytime. Launch eye-catching billboards in Little Rock, Arkansas in minutes and watch your message light up the city.
Trusted by Leading Brands


Billboard advertising
in Little Rock has
never been easier
How much is a billboard in Little Rock?
Why Choose Blip for Billboard Advertising in Little Rock
Blip lets Little Rock advertisers launch fast on I-30 and I-40, reaching commuters, truck traffic, and downtown workers without buying months ahead.
Set a flexible Little Rock budget in Blip and focus on I-630 dayparts for Capitol staff, UAMS shifts, and medical district traffic.
No contracts make Little Rock easy to test—run ads near River Market or West Little Rock, then shift spend to what drives response.
Use Blip’s real-time analytics to track Little Rock campaign lift along I-430 and I-30, then adjust for rush hour and event spikes.
Blip’s creative tools help Little Rock ads stand out with local copy for River Market, Argenta, and the Capitol corridor in seconds.
Daypart Little Rock billboards for 4-7 p.m. exits, lunch runs, and weekend tourism so your message hits when the city is moving.
Frequently Asked Questions About Billboard Advertising in Little Rock
How much does a billboard cost in Little Rock, Arkansas with Blip?
Where can I advertise with Blip in Little Rock, Arkansas?
What kind of audience can Little Rock billboards with Blip reach?
When is the best time to run Little Rock billboards with Blip?
Which Little Rock areas are best for Blip billboard ads?
Do I need a contract to advertise with Blip in Little Rock?
How fast can I launch a billboard campaign with Blip in Little Rock?
Where can I advertise with Blip in Little Rock?
Still have questions? Launch a campaign in minutes — no contracts, no commitments.
Start Your CampaignLittle Rock Billboard Advertising Guide
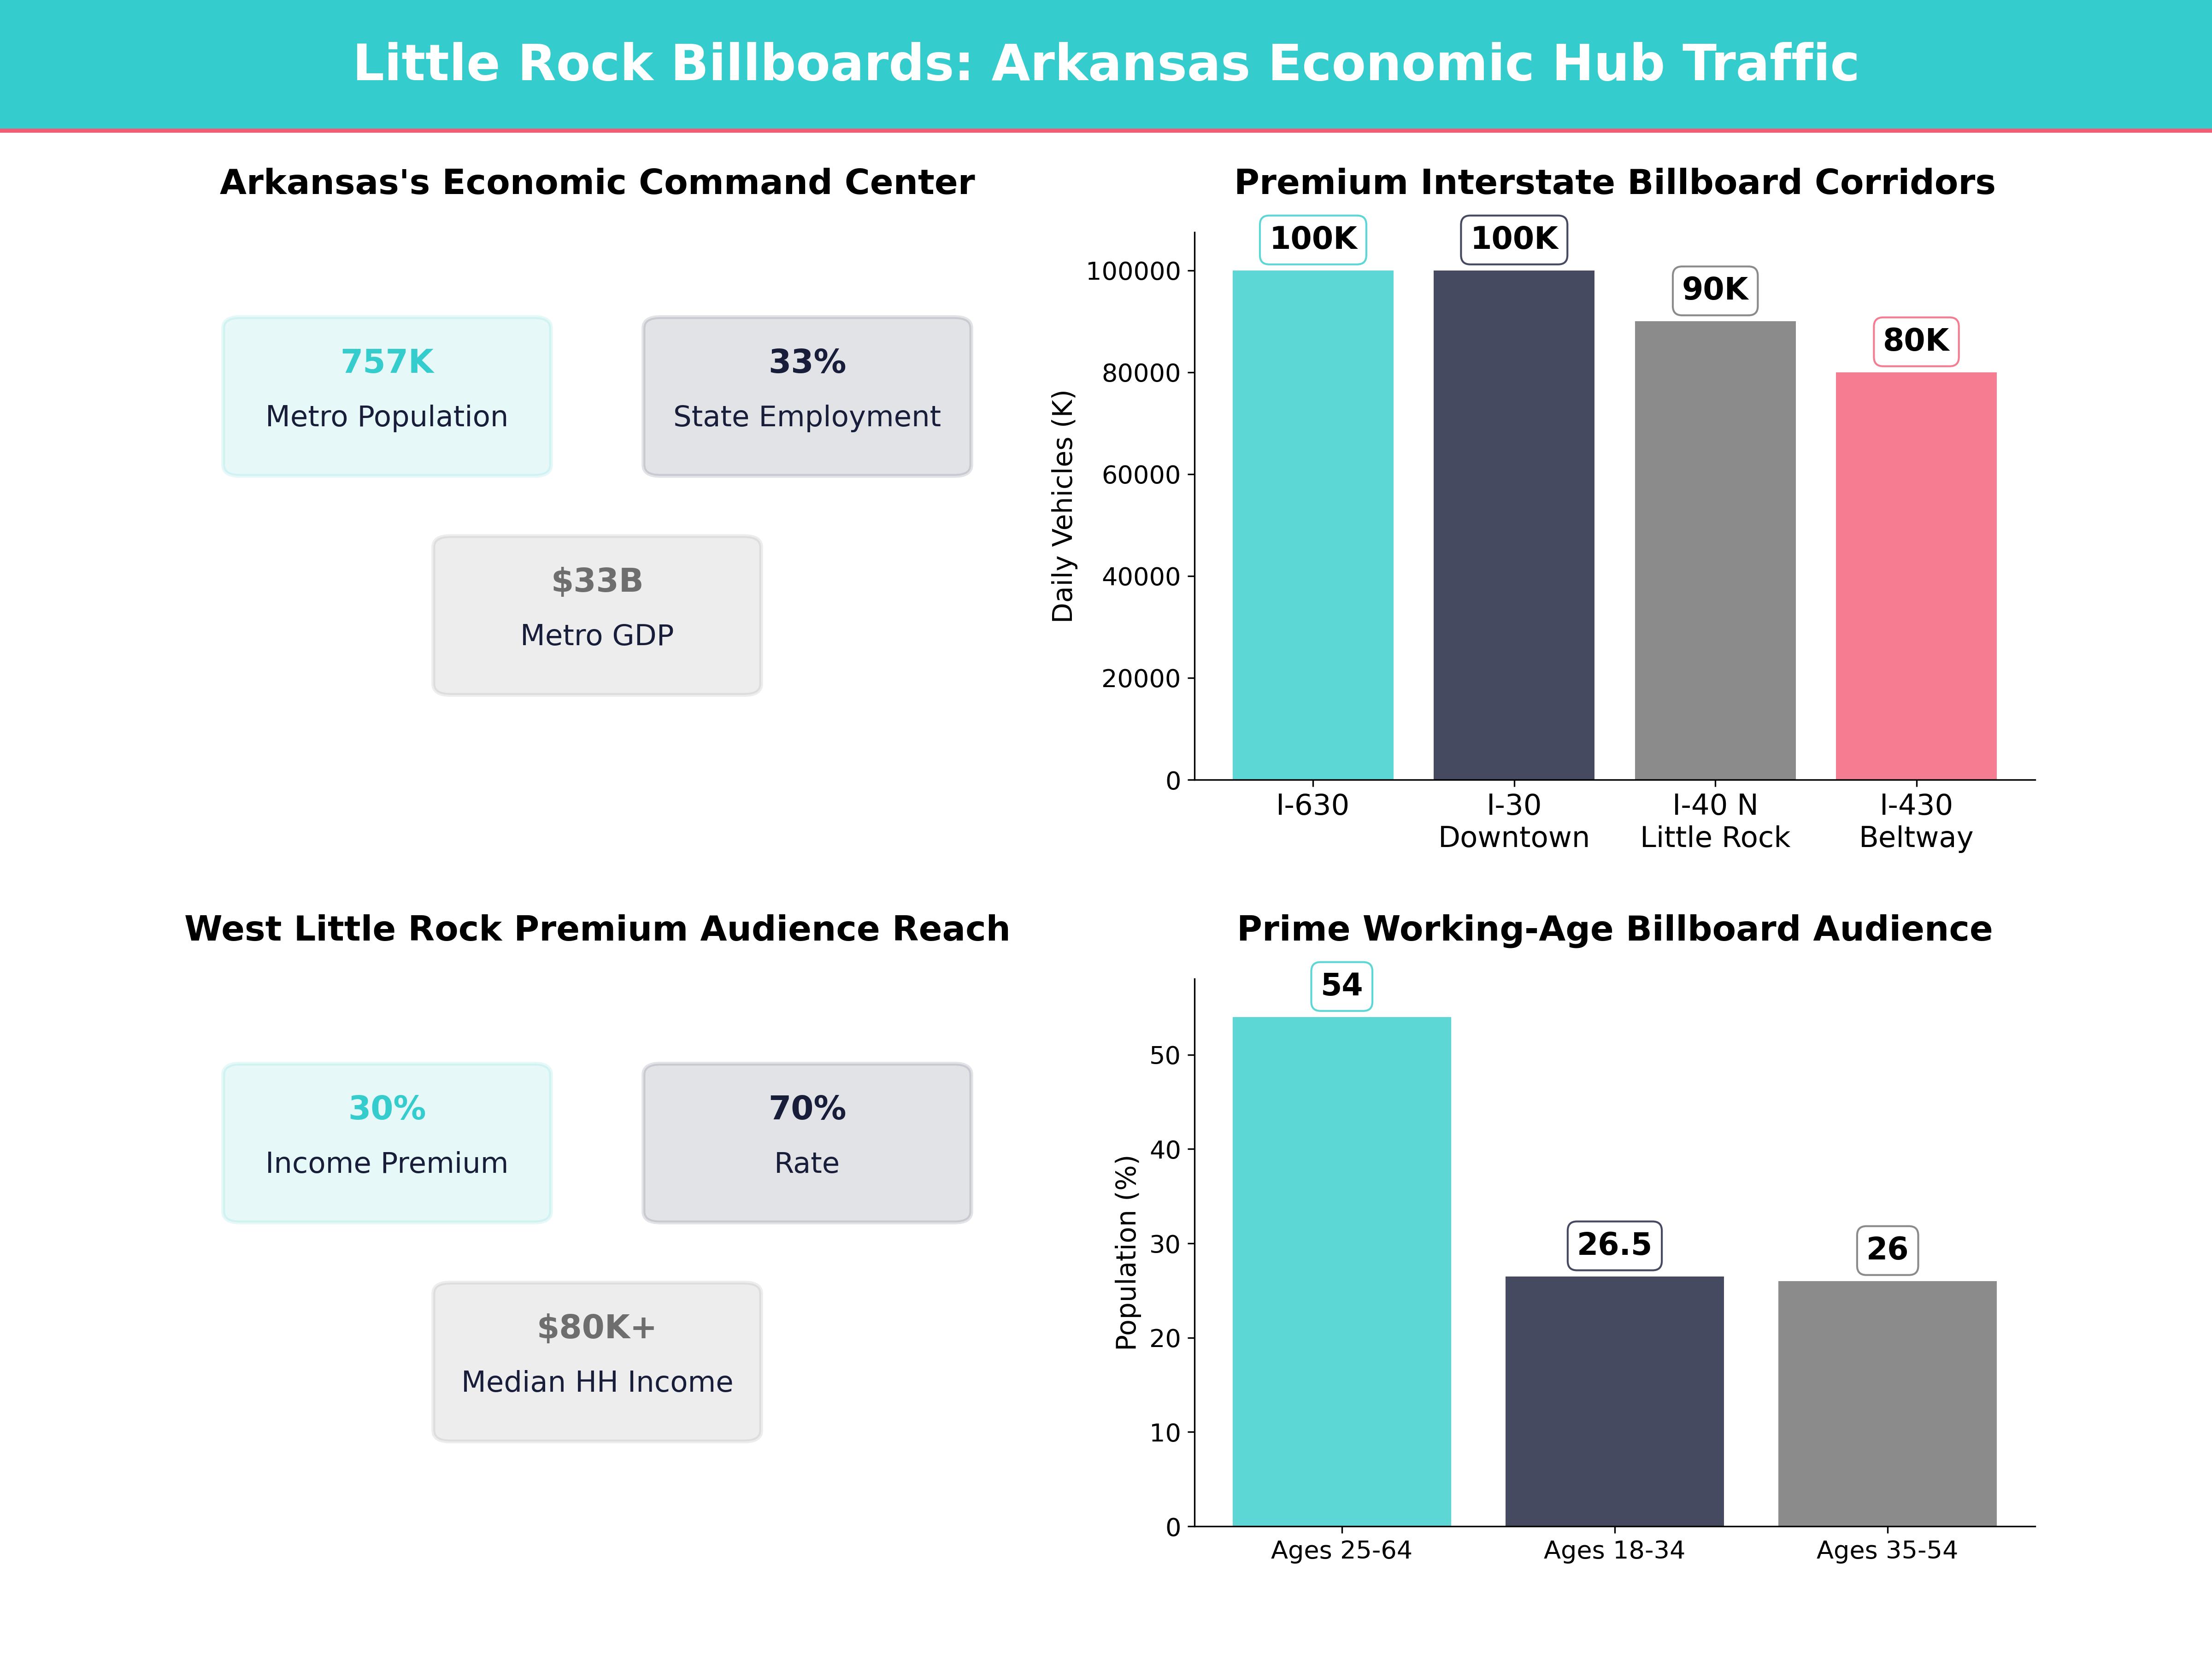
Little Rock is the economic, political, and cultural hub of Arkansas, which makes it an outsized opportunity for advertisers relative to its size. With roughly 204,000 residents in the city and about 757,000 in the broader metro area, we can reach state government employees, healthcare workers, logistics and manufacturing staff, college students, families, and tourists—all within a compact, highly drivable region. Digital billboards powered by Blip let us tap into these audiences precisely where and when they are on the move in and around Little Rock, making Little Rock billboards an efficient way to extend your brand across the metro.
Understanding the Little Rock Market
Little Rock sits at the intersection of two major interstate corridors, I‑30 (Dallas–Texarkana–Little Rock) and I‑40 (Oklahoma City–Fort Smith–Little Rock–Memphis), creating a steady mix of local commuters and pass‑through traffic. The region functions as the primary economic engine of Arkansas, with the Little Rock–North Little Rock–Conway metro accounting for an estimated 30–35% of the state’s total employment and a gross domestic product in the $30–35 billion range. This dense concentration of workers and travelers is exactly why billboards in Little Rock consistently deliver high impression counts for both local and regional advertisers.
Key indicators:
-
Population:
- City of Little Rock: ~204,000 residents
- Pulaski County: ~400,000 residents, nearly 1 in 8 Arkansans
- Little Rock–North Little Rock–Conway metro: ~757,000 residents, about 1 in 4 state residents
- Median age: around 36 years, with roughly 53–55% of residents in the 25–64 working-age segment, supporting strong daytime commuter flows.
- Income: Little Rock’s median household income is in the $52,000–$58,000 range, with significant higher‑income pockets in west Little Rock and neighboring suburbs like Maumelle and Bryant, where many neighborhoods post median household incomes $80,000+.
- Employment base: The metro supports roughly 375,000–400,000 jobs, with unemployment rates often tracking in the 3–4.5% range in recent years—indicative of a tight labor market and competitive recruiting environment.
- Daytime population: State government complexes, hospitals, corporate offices, and the airport swell the daytime population well beyond residential counts, especially downtown and in the I‑630 corridor. Downtown and midtown together can see a weekday daytime population that is 1.3–1.5× their residential base.
- Visitor traffic: Little Rock typically welcomes 6–7 million visitors annually, who generate well over $1 billion in direct travel spending each year, according to local tourism officials.
Local resources worth reviewing for context include the City of Little Rock, regional planning body Metroplan Little Rock Convention & Visitors Bureau. Additional helpful data and planning context are available from Pulaski County, the Little Rock Regional Chamber, and the state’s capital complex managed through Arkansas State Government
For advertisers, this mix means we should plan Little Rock billboard advertising campaigns that speak to:
- Government and professional workers near the State Capitol, downtown, and the I‑630 corridor, where tens of thousands of state and federal employees work across more than 100 agency and office locations.
- Healthcare workers and visitors around the medical district, where the major health systems collectively employ 20,000+ workers in and around the city.
- Suburban families and commuters in west Little Rock, North Little Rock, and Saline County, where homeownership rates often exceed 60–65% and average household sizes are around 2.5–2.7 people.
- Industrial and logistics workers on the periphery and along I‑30/I‑40, supported by more than 20 million square feet of industrial and warehouse space in the metro.
- Tourists visiting the Clinton Presidential Center River Market District, and other attractions, who account for hundreds of thousands of hotel room nights annually.
Audience & Demographic Insights That Shape Billboard Messaging
Little Rock’s demographic profile is diverse and relatively young, which should inform tone, imagery, and offers. The city is one of the more diverse communities in Arkansas and the broader Mid‑South.
Approximate demographic breakdown (city level):
-
Race & ethnicity:
- Black or African American: roughly 42–45%
- White (non‑Hispanic): roughly 43–45%
- Hispanic or Latino: around 8–10%
- Other races and multiracial: ~5–7%
-
Age structure:
- Under 18: around 23–25%
- 18–34: around 25–28%
- 35–54: around 25–27%
- 55+: around 20–22%
-
Household & family:
- Average household size: about 2.4–2.6 people
- Approximately 45–50% of households are family households, with a substantial share of single‑parent families—relevant for childcare, education, and value‑focused offers.
-
Education attainment (25+):
- Bachelor’s degree or higher: about 34–38%
- High school or some college: roughly 55–60%
Implications for creative:
- Inclusive visuals matter. Featuring Black professionals, families, and entrepreneurs alongside multiracial and Hispanic representation will feel authentic to what drivers see around them every day. In a city where a majority of residents are people of color or from diverse backgrounds, lack of representation can noticeably reduce relevance.
- Family‑oriented messaging resonates. With nearly half of residents under 35 and a significant share in family‑forming years, offers that address childcare, family dining, entertainment, home improvement, and education can perform well. School‑related schedules (Little Rock School District enrolls 20,000+ students) also shape traffic patterns.
- Value‑conscious, not bargain‑only. Median income levels mean value is important, but we should avoid messaging that feels “cheap.” Emphasize “more for your money,” durability, and local support. Roughly 30–35% of households earn $75,000+, creating room for premium offers positioned around long‑term savings, reliability, and quality.
Top employment sectors in the Little Rock area include:
- Government & public administration (state agencies, city, county, and federal offices), together supporting well over 40,000 government jobs in the region.
- Healthcare & social assistance ( Baptist Health CHI St. Vincent, UAMS), which collectively employ tens of thousands and represent one of the fastest‑growing sectors.
- Finance & insurance (Simmons Bank, Bank OZK, Stephens Inc.
- Transportation, warehousing & logistics, leveraging the city’s interstate crossroads, the Port of Little Rock 6,000+ direct and indirect jobs.
- Education, with institutions like UA Little Rock Philander Smith University, and nearby University of Arkansas for Medical Sciences and UA–Pulaski Technical College.
We can tailor campaigns by sector—for instance:
- Targeting healthcare employees on commutes with recruitment or continuing education messages. UAMS, Baptist Health, and CHI St. Vincent together employ more than 12,000–15,000 people in clinical and support roles.
- Targeting state workers with lunch, banking, or after‑work entertainment offers near downtown corridors where thousands of employees leave the Capitol complex and state office buildings between 4 and 5:30 p.m. each weekday.
- Targeting logistics and warehouse workers with job openings or trade services along I‑30 and I‑40, where clusters of distribution centers and trucking operations contribute to the region’s tens of millions of tons of freight handled annually, and where well‑placed Little Rock billboards can serve as constant recruitment touchpoints.
Commuter Patterns & High‑Impact Corridors
Traffic patterns should drive how we allocate impressions and time our Blip campaigns. According to counts referenced by the Arkansas Department of Transportation Metroplan 70,000 and 120,000 vehicles per day, with peak‑hour flows that can exceed 5,000–6,000 vehicles per lane per hour on the busiest stretches. These volumes make billboard rental in Little Rock particularly attractive for advertisers who need consistent daily reach.
Key corridors:
-
I‑30 (southwest Little Rock to downtown and across the river)
- Daily traffic volumes commonly in the 90,000–110,000 vehicle range near downtown, with some segments approaching 120,000 vehicles.
- Critical for commuters from Benton, Bryant, Alexander, and southwest Little Rock heading into central Little Rock; many of these communities have seen population growth of 10–20% over the past decade, adding new daily commuters.
-
Ideal for:
- Daily‑needs retail (grocery, gas, QSR) targeting workers and families who pass the same exits 10 times per week.
- Commuter services (childcare near job centers, park‑and‑ride, auto repair) where even a 1–2% response rate from repeat exposures can generate substantial foot traffic.
- Tourism and downtown events (River Market District, Robinson Center, Simmons Bank Arena across the river).
-
I‑40 (west–east across North Little Rock)
- Often 80,000–100,000+ vehicles per day through North Little Rock, including heavy truck traffic. In some segments, trucks can account for 20–25% of total volume.
- Mix of through‑traffic (Oklahoma City ↔ Memphis) and local commuters from Conway, Maumelle, and Cabot, many of whom travel 20–40 miles each way.
-
Strategic for:
- Travel‑related advertisers (hotels, attractions, restaurants) targeting an estimated tens of thousands of out‑of‑area vehicles each day.
- Regional brands seeking statewide or cross‑state reach.
- Logistics recruiting and business services, as I‑40 is one of the region’s primary freight corridors.
-
I‑430 (western bypass)
- Connects I‑30 to I‑40 west of the river; daily volumes typically 70,000–90,000 vehicles.
- Passes through or near west Little Rock, one of the metro’s higher‑income areas, where many ZIP codes have household incomes 20–40% above the city median.
-
Strong for:
- Higher‑end retail and dining.
- Home services (roofing, HVAC, lawn care) targeting homeowners—homeownership rates in some west Little Rock areas exceed 70%.
- Healthcare and professional services (dentistry, cosmetic procedures, financial advisors) where customer lifetime value is high.
-
I‑630 (The Wilbur D. Mills Freeway)
- Crosses the city east–west, linking west Little Rock neighborhoods with the medical district and downtown.
- Sections often exceed 100,000 vehicles per day; in the medical district area, peak‑hour volumes align with hospital shift changes at 7 a.m., 3 p.m., and 7 p.m.
-
High impact for:
- Medical services, hospitals, clinics, insurance.
- Lunch and after‑work dining, given the dense cluster of offices and hospitals.
- Colleges and training programs targeting workers and students commuting to UA Little Rock, Philander Smith, and UAMS.
-
I‑530 (Little Rock to Pine Bluff)
- Traffic lighter than I‑30/I‑40 but highly focused, connecting southern suburbs and Pine Bluff commuters, with daily volumes often in the 30,000–45,000 vehicle range near Little Rock.
- Effective for reaching southern Pulaski and Jefferson County residents, many of whom make 30–60‑minute commutes.
With Blip, we can choose specific boards along these routes, then adjust our bids and schedules to match commuter flows, turning standard billboard rental in Little Rock into a highly targeted, data‑driven channel:
- Inbound morning focus (6–9 a.m.) on I‑30 and I‑40 → downtown, medical district, and industrial zones. Morning peak periods often see 20–25% of the day’s traffic within these three hours.
- Outbound evening focus (4–7 p.m.) for messages about shopping, dining, entertainment, and home services, when commute times lengthen with congestion.
- Midday rotations (11 a.m.–2 p.m.) near malls and commercial hubs for lunch and retail promotions. Many quick‑service restaurants generate 30–40% of daily sales in this window, making impressions especially valuable.
Ready to reach your audience in Little Rock?
Start Your Campaign →Neighborhood & Micro‑Market Targeting
Different parts of the Little Rock area call for different tones and offers. Micro‑targeting boards by neighborhood lets us align with local demographics, income levels, and trip purposes.
-
Downtown & River Market District
- Anchors key attractions like the Clinton Presidential Center Riverfront Park River Market District.
- Strong daytime worker population plus tourists—over 7 million visitors annually to Little Rock’s attractions, according to the Little Rock Convention & Visitors Bureau. Major downtown attractions individually can draw 100,000–300,000+ visitors per year.
- Hotel occupancy downtown can reach 70–80% during peak seasons and event weeks.
-
Use billboards to:
- Drive foot traffic to restaurants, bars, and entertainment venues—especially since many visitors park once and then walk within a 0.5–1‑mile radius.
- Promote events at Robinson Center, Simmons Bank Arena, and festivals on the riverfront, where single events can attract 5,000–15,000+ attendees.
- Highlight parking apps, transit services, and rideshare offers to capture a share of the thousands of daily parking transactions downtown.
-
West Little Rock
- Higher household incomes and newer residential developments, with many neighborhoods experiencing double‑digit population growth over the last decade.
- Concentration of shopping centers and professional offices, including large retail hubs where weekend daily traffic counts can spike to 20,000–30,000 vehicles on adjacent arterials.
-
Effective for:
- Premium services (cosmetic dentistry, elective medical, financial planning) aimed at households more likely to spend above state averages on health, wellness, and financial services.
- Home improvement and real estate in an area where home values and renovation spending outpace other parts of the city.
- After‑school programs and youth activities, as a high share of households include children under 18.
-
North Little Rock
- Includes the Argenta Arts District Simmons Bank Arena, and significant residential neighborhoods served by major routes like I‑40, I‑30, and JFK/Highway 107.
- Simmons Bank Arena alone can host 100+ events annually, many bringing 5,000–18,000 visitors at a time.
-
Great for:
- Entertainment and nightlife promotions tied to Argenta’s restaurants, breweries, and galleries.
- Local events and sports, including minor league and high‑school events that pull in fans from across central Arkansas.
- Retail, auto dealerships, and services on major arteries that see tens of thousands of vehicles per day.
-
South and Southwest Little Rock
- More industrial activity, warehouses, and blue‑collar employment, plus established neighborhoods.
- The area benefits from proximity to the Port of Little Rock
-
Strong for:
- Hiring campaigns (distribution centers, plants, construction) in a labor shed with a high share of working‑age adults and trades.
- Trade schools, CDL training, and workforce programs that can tap into a large pool of potential students within 15–30 minutes of campus.
- Auto services and value‑oriented retail positioned around payday cycles and shift changes.
With Blip, we can group boards into “micro‑markets” (e.g., “West LR upscale,” “Industrial Southwest,” “Downtown tourism”) and allocate different creative messages and budgets to each. For example, dedicating 60–70% of impressions to high‑value customer segments while keeping 30–40% for broad awareness across the metro. This micro‑market approach turns billboards in Little Rock into a highly segmented medium instead of a one‑size‑fits‑all buy.
Timing Campaigns Around Little Rock’s Calendar
Seasonal and event‑driven traffic patterns can make our impressions more valuable if we time campaigns well. Many local events and cycles can produce 5–20% bumps in traffic and visitor activity in specific corridors.
Political & Government Cycles
As the state capital, Little Rock sees regular spikes in politically engaged traffic:
- Legislative sessions at the State Capitol draw lobbyists, advocates, and visitors. During peak committee weeks, the Capitol complex can host hundreds of additional visitors per day, alongside thousands of regular state employees.
- Election cycles increase political ad volume and news consumption, covered intensively by outlets like the Arkansas Democrat‑Gazette KATV, KARK THV11. Audience data from local outlets show TV news viewing and online engagement can climb 10–30% in the final weeks before major elections.
For non‑political advertisers, we can:
- Avoid getting lost in peak political weeks by front‑loading campaigns slightly before or after, when CPM‑equivalent competition is lower.
- Or, run “brand trust” messaging when public attention is high and people are primed to evaluate institutions and credibility, which can improve ad recall and favorability scores by several percentage points in survey‑based tracking.
Sports & Events
Little Rock may not have major league franchises, but sports are a big driver of traffic:
- High school football in the fall, with regional rivalries filling stadiums on Friday nights. Larger games can attract 3,000–8,000 spectators, many traveling across the metro.
- College sports interest (Arkansas Razorbacks, Little Rock Trojans Razorback football games can create game‑day spikes of 20–30% in bar and restaurant sales at popular watch spots.
- Simmons Bank Arena and downtown venues draw thousands for concerts and events throughout the year; a strong concert calendar can add dozens of high‑impact nights annually.
With Blip’s scheduling, we can:
- Increase bids and frequency in the 3–7 p.m. window on game or event days near key routes, when inbound traffic to venues is heaviest.
- Run countdown creatives (“Tonight 7 PM – Park Free at…”) to boost urgency; event‑adjacent campaigns often see short‑term spikes of 10–25% in visits or sales compared to non‑event days.
Tourism Seasons
According to tourism officials, Little Rock hosts millions of visitors annually, with peaks typically in:
- Spring (March–May): Outdoor festivals, school trips, and milder weather; some attractions report visitor counts 20–30% higher than winter months.
- Summer (June–August): Family travel, riverfront activities, and regional tourism, contributing a large share of annual hotel occupancy and attraction attendance.
- Early fall (September–October): Events, conferences, and more pleasant temperatures that support strong convention and meeting attendance.
During these periods, we can:
- Shift more impressions to downtown, airport, and interstate boards that intercept visitors. The Bill and Hillary Clinton National Airport serves around 2 million passengers annually, many of whom rent cars or use rideshare services that travel on I‑30, I‑440, and I‑530.
- Feature creatives with “first‑stop” offers: coffee, breakfast, attractions, and hotels, capturing spending from travelers who typically spend $100–200+ per day on lodging, food, and entertainment.
- Promote online booking links or QR codes to capture visitors who are still planning their stay on the road; mobile research accounts for a majority of last‑minute local search activity among travelers.
Crafting Effective Creative for Little Rock Drivers
Digital billboards in Little Rock must break through both local familiarity and commuter routine. A few design principles are especially important here:
-
Short, high‑impact copy
- Aim for 6–10 words max; traffic on interstates moves at 55–70 mph, leaving only 5–8 seconds of view time at typical billboard distances.
-
Examples:
- “Roof Leaks? Little Rock’s 1‑Day Fix.”
- “Downtown Lunch in 10 Minutes – Exit Now.”
-
Localization that feels real
-
Reference familiar landmarks or corridors:
- “By the Big Dam Bridge? We’re 5 Minutes Away.”
- “Next Exit to River Market Parking.”
- Use local language and nicknames (“Big Dam Bridge,” “River Market,” “Argenta”) that residents recognize instantly, which can improve message recall by 10–20% compared with generic phrasing.
-
Reference familiar landmarks or corridors:
-
Color contrast and legibility
- Many commutes occur at dawn or dusk along tree‑lined or cluttered corridors, and around 1/3 of annual daylight hours fall into lower‑light conditions.
- Use high‑contrast color pairs (dark background, light text or vice versa) and large fonts sized so key words are legible from 400–600 feet.
- Avoid thin fonts or script typefaces that blur at distance; clear typography can improve comprehension rates by 20–30% at highway speeds.
-
Weather‑responsive & time‑based messaging
-
Summer heat in Little Rock often hits the 90s and 100s, with 30+ days per year at 95°F or higher—perfect for:
- “It’s 98° – $0.98 Drinks All Day.”
-
Rainy days or storms (Little Rock typically records 45–55 inches of rain annually):
- “Storm Damage? Call Before You Get Home.”
- Leverage Blip’s scheduling to rotate weather‑ or time‑relevant versions, which typically see higher engagement and recall than static, all‑season copy.
-
Summer heat in Little Rock often hits the 90s and 100s, with 30+ days per year at 95°F or higher—perfect for:
-
Clear calls to action
-
For a commuter at 65 mph, we need one simple action:
- “Exit 139B – Turn Right.”
- “Text ‘LRDEALS’ to 55555.”
- “Search: ‘Dentist Little Rock West’.”
- Single‑step CTAs can outperform complex instructions by 30%+ in response‑rate tests.
-
For a commuter at 65 mph, we need one simple action:
Ready to reach your audience in Little Rock?
Start Your Campaign →Using Blip’s Tools Strategically in Little Rock
Blip’s flexibility lets us combine all these local insights into smart Little Rock billboard advertising structures.
Dayparting
We can concentrate our budget in the hours that match the audience we want, rather than buying low‑value overnight or off‑peak impressions.
-
Morning (6–10 a.m.)
- Coffee shops, breakfast, radio stations, finance, job recruiting.
- Messages focused on “Today,” “On Your Way In,” “Before Work.” Morning traffic can represent 25–30% of weekday daily volume on certain commuter corridors.
-
Midday (10 a.m.–3 p.m.)
- Restaurants, retail, medical clinics, same‑day services.
- Great for promotions near shopping centers and the medical district, where lunchtime visits and outpatient appointments peak. Many medical practices schedule 40–50% of daily visits between 10 a.m. and 2 p.m.
-
Evening (3–8 p.m.)
- Family dining, entertainment, home services, political ads, sports.
- Use after‑work CTAs like “Tonight,” “On Your Way Home,” “After the Game.” This window captures both outbound commuters and event traffic, often accounting for another 30–35% of daily freeway volume.
-
Late night (8 p.m.–midnight)
- Bars, late‑night food, streaming services, rideshare, towing, and urgent‑care.
- Though volumes drop, these impressions can have outsized impact for categories where late‑night demand is concentrated (for example, late‑night QSR can see 15–20% of daily sales after 8 p.m.).
By shifting bids across these windows, we can maintain presence even with modest budgets while avoiding less valuable impressions. For example, dedicating 70–80% of budget to peak dayparts and keeping 20–30% for low‑cost off‑peak experimentation.
Location Targeting
We can choose specific Blip boards near:
- Government centers to reach state employees and policy influencers around the Capitol, Main Street, and I‑630.
- Hospitals and medical campuses (UAMS, CHI St. Vincent, Baptist Health) for healthcare recruitment and patient acquisition.
- Shopping hubs (west Little Rock, North Little Rock, Shackleford, Rodney Parham, Chenal, and major retail corridors).
- Industrial zones and logistics hubs along I‑30 and I‑40 and near the Port of Little Rock
We often see success by:
- Running brand or trust‑building messages metro‑wide to build familiarity across the 700,000+ residents who may see your message multiple times per week.
- Layering location‑specific offers only on boards within a 5–10‑minute driving radius of the advertised business, concentrating conversion‑oriented impressions where they are most likely to turn into visits.
Budgeting & Bidding
Because Blip operates on a per‑“blip” (ad play) basis, we can:
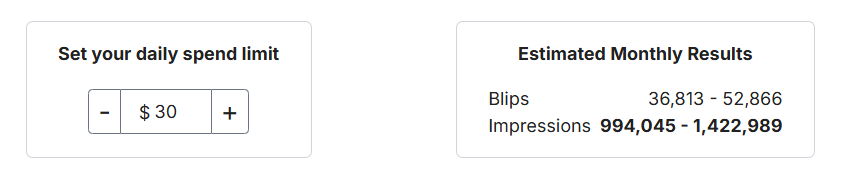
- Start testing with small daily budgets (for example, $10–$20/day) focused on one or two corridors. Even at this level, Little Rock billboards can secure dozens to hundreds of daily ad plays depending on competition and time of day.
- Increase budgets on the top‑performing routes or time windows once we see lift in web traffic, calls, or store visits. Many advertisers see noticeable impact once campaigns reach thousands of plays per week on key boards.
- Dial spending up during major events (festivals, arena events, legislative sessions) and down afterward, effectively “surging” activity during 10–20 high‑value days per month.
Testing and Optimizing Creative for Little Rock
Continuous testing is especially important in a market where commuters see the same routes daily—some drivers pass the same boards 200–250 times per year.
We can:
-
A/B Test Headlines
-
Example:
- Version A: “Little Rock’s Fastest Oil Change – Exit 140”
- Version B: “Oil Change in 15 Minutes – Exit 140”
-
Rotate both across the same boards and hours, then compare:
- Web visit spikes near I‑30 corridor (sessions from ZIP codes along I‑30 increasing by 10–20% when the better‑performing creative runs).
- Coupon redemptions or “How did you hear about us?” responses.
-
Example:
-
Test Local vs. Generic Messaging
- Hyper‑local: “West Little Rock Families Save 20% This Week.”
- Generic: “Save 20% on Home Security This Week.”
- Localized ads often outperform because they feel more relevant; advertisers frequently see higher recall and click‑through rates when city or neighborhood names are used in copy.
-
Rotate Campaign Themes by Month
- January–February: fitness, financial planning, tax prep—tied to New Year’s resolutions and tax season, when interest in these services can spike 20–40%.
- March–May: home services, landscaping, events, as homeowners prepare for spring and outdoor activities ramp up.
- June–August: travel, family fun, ice cream/QSR, A/C services—capitalizing on school breaks for the 20,000+ public school students and the city’s hot summers.
- September–November: back‑to‑school, heating, roofing, college recruitment.
- December: holiday retail, events, charitable giving—nonprofits often raise a substantial share of annual donations in the last 6–8 weeks of the year.
Little Rock’s climate and school calendar underpin these shifts, so aligning your creative with what’s happening in people’s lives boosts response and maximizes the value of each impression.
Example Campaign Concepts by Industry
To make these principles concrete, here are sample approaches tailored to Little Rock:
Local Restaurant Near River Market
-
Boards: Downtown and I‑30 approaches, plus routes feeding into the River Market District.
- Dayparts: 11 a.m.–2 p.m. (lunch), 4–8 p.m. (dinner).
-
Creative:
- “Lunch at River Market – Park Free with Receipt.”
- “Kids Eat Free Tonight – 2 Blocks from the Riverfront.”
- Tactics: Increase bids during major concerts or events reported by local event calendars. On big‑event nights, restaurants can see 10–30% higher sales, so a temporary bid increase can deliver strong ROI.
Regional Home Services Company (Roofing/HVAC)
- Boards: I‑430, I‑630, and west Little Rock arterial roads; some coverage in North Little Rock.
- Dayparts: Morning and evening commutes, especially during peak storm and heat seasons.
-
Creative:
- “West Little Rock Roof Leaks? Call Before the Next Storm.”
- “AC Struggling? 24/7 Service Across Little Rock.”
- Tactics: Weather‑aligned rotations—storm, heatwave, or seasonal checkups. After major hail or wind events, inbound calls for roofing and repair services can jump 2–3× within a week, making rapid creative swaps especially valuable.
Healthcare System or Clinic
- Boards: Near the medical district, I‑630, and major residential corridors.
- Dayparts: All day, with heavier weighting 7 a.m.–7 p.m., aligned with clinical hours and shift changes.
-
Creative:
- “Primary Care in 24 Hours – Near I‑630 & University.”
- “Heart Care Right Here in Little Rock – Schedule Today.”
- Tactics: Different creatives for urgent care, specialty clinics, and recruitment targeting healthcare workers commuting to other facilities. Recruitment campaigns can highlight sign‑on bonuses, flexible shifts, and benefits—key factors in a healthcare job market where vacancy rates in some specialties exceed 10–15%.
Higher Education or Trade School
- Boards: I‑30 (southwest), I‑40 (to/from Conway), near UA Little Rock corridor, and along routes serving UA–Pulaski Technical College.
- Dayparts: 6–9 a.m. and 3–8 p.m. to catch current workers and high‑school students commuting.
-
Creative:
- “Earn Your CDL in 8 Weeks – Little Rock Campus.”
- “Nursing Degree, Local Campus – Classes Start Aug 19.”
-
Tactics: Heavy rotation around:
- High school graduation months (May–June), when interest in training programs and college spikes.
- New semester start dates (August–September, January). Community and technical colleges often see largest enrollment surges in the weeks just before term start, so short, intense campaigns can be effective.
Ready to reach your audience in Little Rock?
Start Your Campaign →Bringing It All Together
Little Rock offers a concentrated mix of state government, healthcare, logistics, education, and tourism—all intersecting across a compact highway network that routinely moves tens of thousands of vehicles per day on each major corridor. By pairing local knowledge of those corridors, neighborhoods, and seasonal patterns with Blip’s flexible tools—dayparting, location selection, and easy creative swaps—we can build billboard campaigns that:
- Reach the right audiences (state workers, families, tourists, industrial workers, students).
- Appear at the right times (commutes, event nights, peak tourism months).
- Deliver the right messages (localized, concise, and visually strong).
When we consistently test and refine our creative and placement, digital billboards in Little Rock become not just a branding play, but a measurable growth engine for local and regional businesses alike—supporting everything from neighborhood restaurants and clinics to regional home‑service brands and institutions that serve the entire 757,000‑person metro area.